Good morning, fellow investors. As of this writing, the DJIA is at 24,884, gold is at $1,334 an oz., silver sits at $16.74, and WTI has dropped a bit to $62.42 a barrel.
Perhaps the most interesting index of late is the volatility index, which has dropped from 25 to 18.17 over the last two weeks. I wrote about the importance of the VIX two weeks ago in the midst of the sell-off.
Funny Thing About Bubbles
This current bull market has been called the “everything bubble” because, well, everything is expensive.
The United States is racking up massive debt in government — federal, state, and local. At the same time, business loans are at records, as are student, car, and credit card loans.
There are other bubbles, like the one in art. This Leonardo da Vinci sold for $450 million last month…

There is a bubble in classic cars — a 1965 Ferrari sold for $8 million. Real estate is off the charts in places like Vancouver and Sunnyvale, where an 848-square-foot crap shack sold for $2 million.
There is no doubt that 10 years of global money printing has pushed asset prices higher. But we’ve seen this movie before. Central banks attempt to save the economy by printing money, then the economy takes off, at which point the central banks pull back on the money, at which point the economy crashes. Rinse and repeat.
It matters not that the central bankers are basically just chimps with hammers banging away at a market they cannot hope to understand, much less “fix.” The basic premise that you can control a market with a trillion inputs is as preposterous as it is arrogant.
You can’t have good days without bad, and you can’t have bull markets without bears. Trying to eliminate bear markets just sets up the next one to be worse, and it will be. The next one won’t just be in tech stocks or just in housing… it will be in everything.
And yet, when the Fed holds a meeting at crunch time with all the too-big-to-fail banks, Time magazine will put their picture on the cover and declare them saviors.
Frauds
The problem of this cycle is that in each case, we are left with more debt and less equity. It seems obvious, but the way to solve the riddle, for you personally, is to zig when they zag. When they start to take money off the table, you should, too!
And after the market is crushed yet again, like it has been twice over the last 18 years, you buy!
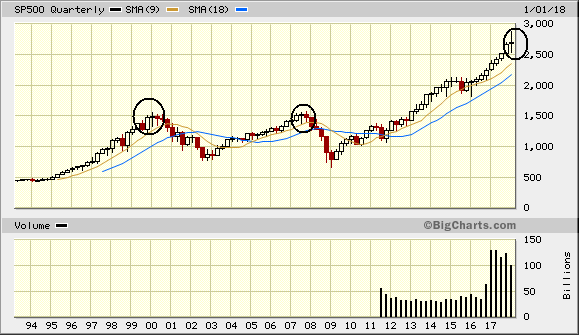
The question is when to sell, and how do you know? According to this chart, the answer is within two quarters.
Our analysts have traveled the world over, dedicated to finding the best and most profitable investments in the global energy markets. All you have to do to join our Energy and Capital investment community is sign up for the daily newsletter below.
Let’s take a technical view. Here is the S&P 500:

Volume is up while the market is moving higher. That suggests the smart money is selling. Also notice that in the last two market crashes — 2000 and 2008 — there was a nice doji cross. That means the market has fought to a standstill. Bulls and bears each had momentum expanding the trading range but closing at the same point.
When this happens at the top of a long uptrend, like now, it is a strong turnaround signal. It’s like a flag planted at the top of the mountain. It’s all downhill from here.
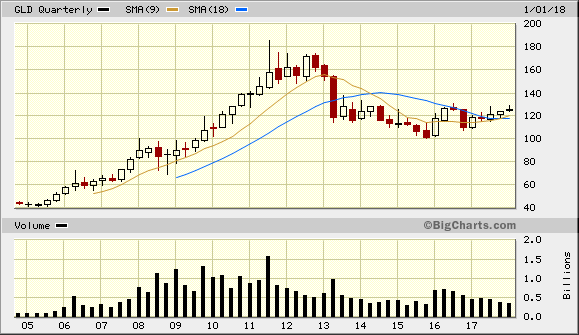
These two charts say sell stocks and buy gold. Or at least put more money in cash. But remember, each candlestick represents three months. So it won’t happen tomorrow but could very well in August, September, or October.
Bullish Gold Chart of the Day:

Here is your long-term gold ETF (NYSE: GLD) chart. Again, each candlestick represents a quarter.
Gold is moving higher on falling volume. That’s bullish. It has also crossed above its moving averages and broken its downtrend. That is also bullish. So, again, you may want to consider selling some stocks and buying gold.
All the best,

Christian DeHaemer
Christian is the founder of Bull and Bust Report and an editor at Energy and Capital. For more on Christian, see his editor’s page.

