About seven weeks ago, on December 7, 2021, I put out an alert with the subject line “I Hate to Say This, But…”
Here’s what I wrote:
This is the most ominous chart I’ve seen in years:
This is a five-year monthly candlestick chart of the SPX. The SPX is based on the 500 top companies in the United States.
Each candlestick represents a month. The chart goes back to 2017.
That red candlestick from two months ago (October) that looks like an upside-down hammer is called a “gravestone doji.”
I went on to explain the chart and ended with:
We are 12 years into this heated bull market. A 700–1,000-point drop on the S&P 500 could happen over the next few months. I’ve been telling my Launchpad Trader readers to take profits, banking short-term gains like 93% in Encore Wire Corp (NASDAQ: WIRE) and 90% in Asana Inc. (NYSE: ASAN).
I’m making the call. It’s time to change your mindset from “buy the dips” to “sell the rips.” No one ever went broke taking a profit.
You can read the whole thing here.
It turns out I was absolutely correct with that bearish call from early December and you were correct to take some money off the table. The S&P has fallen 800 points from its highs, but it’s no time to panic sell. The correction is running out of steam, and we should bounce this week.
Our analysts have traveled the world over, dedicated to finding the best and most profitable investments in the global energy markets. All you have to do to join our Energy and Capital investment community is sign up for the daily newsletter below.
Here’s Why
First of all, this has been a tech sell-off, with riskier stocks taking the biggest hits. But the blue chips have been knocked around as well. Microsoft fell from $349 to $282, and Apple dropped from $182 to $157.
And those are the market leaders. Everyone owns them in some fund, 401(k), or ETF. But here’s the thing: Both of these companies are reporting earnings this week.
Microsoft in particular should do well. It’s beaten expectations each of the last four quarters, and its business — so far, anyway — has been immune to supply chain issues, inflation, and COVID lockdowns.
Apple gets a lot of money from services these days, and those numbers should be up because of the new COVID economy. Of course, we won’t know until the reports are out.
However, the real reason I expect a bounce is because the charts tell me so.
An Abandoned Baby
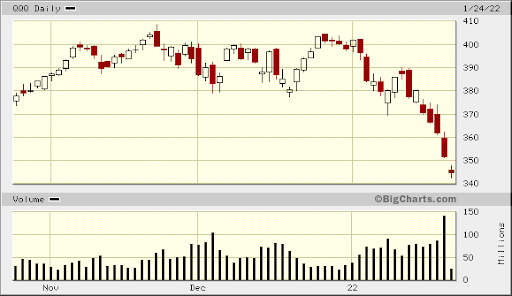
The Nasdaq yesterday showed an “abandoned baby” doji, or at least the first part of it. If the market closes up today, higher than the close yesterday, we will have a clear turnaround signal. Generally, you can expect the market to bounce back 50%. In this case, the QQQ fell from $390 to $344. The initial bounce would put it back at $367 or so.
That red cross-looking candlestick at the end is called an “abandoned baby.” It has a gap down followed by a gap up.

Furthermore, candlestick charts tend to run in three–five-unit series. We are now down five days in a row, which means we are due for a reversal to the mean.
And you’ll note the massive volume spike from the last trading session. Bottoms are formed when all the sellers sell. A big down day with corresponding large volume is called a capitulation low.
So if you’re looking to panic sell, don’t. At least not yet. It’s always a good idea to wait for the dead cat to bounce.
All the best,
Christian DeHaemer Christian is the founder of Bull and Bust Report and an editor at Energy and Capital. For more on Christian, see his editor’s page.


