Well, it’s been a heck of a year. The S&P 500 is up about 18% as I write this. It has a P/E of 26.5 and is bouncing off all-time highs around 2,660. Was it only eight and a half years ago that it was bouncing off the bottom at 666?
Remember those wistful days of Lehman Brothers and liar loans? There was much pulling of hair and rending of shirts as seemingly half the population lost their house, wife, and job at the same time. Roughly 8.7 million jobs were shed from February 2008 to February 2010, and GDP contracted by 5.1%.
American household net worth fell from a pre-recession peak of $68 trillion in Q3 2007 to $55 trillion by Q1 2009. At the same, time real median household income fell from $56,436 in 2007 to $51,758 by 2012.
Real estate foreclosures climbed from 239K in 2007 to over 932K per quarter in 2009.
I’m sure you knew many people who lost their fortunes. One young couple I knew was trapped owning two houses and a bridge loan at a time when they could afford neither.
But somehow it all worked out, and here we are again. As Johnny Cash would say, we are doing mighty fine in our streak of lightning cars and our fancy clothes.
The stock market is flying. Real estate is back with a vengeance. Cryptocurrencies like Bitcoin and Ripple are reeling in those who like to buy now what they regret not buying last year. Even muscle cars and fine art are selling at record prices.
But something feels a bit off… Us contrarians know the bad times inevitably follow the good. Humans have known about this for thousands of years, which is why Joseph spoke about seven years of fat, followed by seven years of lean.
Ole Joe was a contrarian, always buying low. If you remember your Sunday school, Joseph wisely saved 20% of the harvested grain during the good times and was able to save not only Egypt during the famine but the surrounding nations as well.
Biblical Keynesian
There is something in human nature that pushes optimism to the extreme, leverages up, goes into debt, gets knocked down, retrenches, and then starts the cycle all over. Your humble editor thinks this has something to do with short memories and a new crop of young people who were too young to remember.
Oddly enough, seven years is about the average length of a bull market. No bull market has made it to its 10th birthday. But four have made it past seven years.
With that in mind, here are some charts you can mention to that perma-bull nephew of yours at dinner next week.
1. Personal Savings Rate
The savings rate has fallen again.

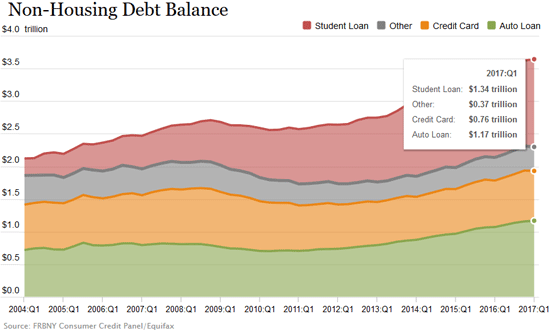
2. Personal Debt is Up
Personal debt is well above the last crisis.

Credit card delinquency rates for U.S. banks rose to 2.47% in the second quarter from 2.20% a year earlier. Historically, when these start to rise, they continue to move up until a crisis hits.
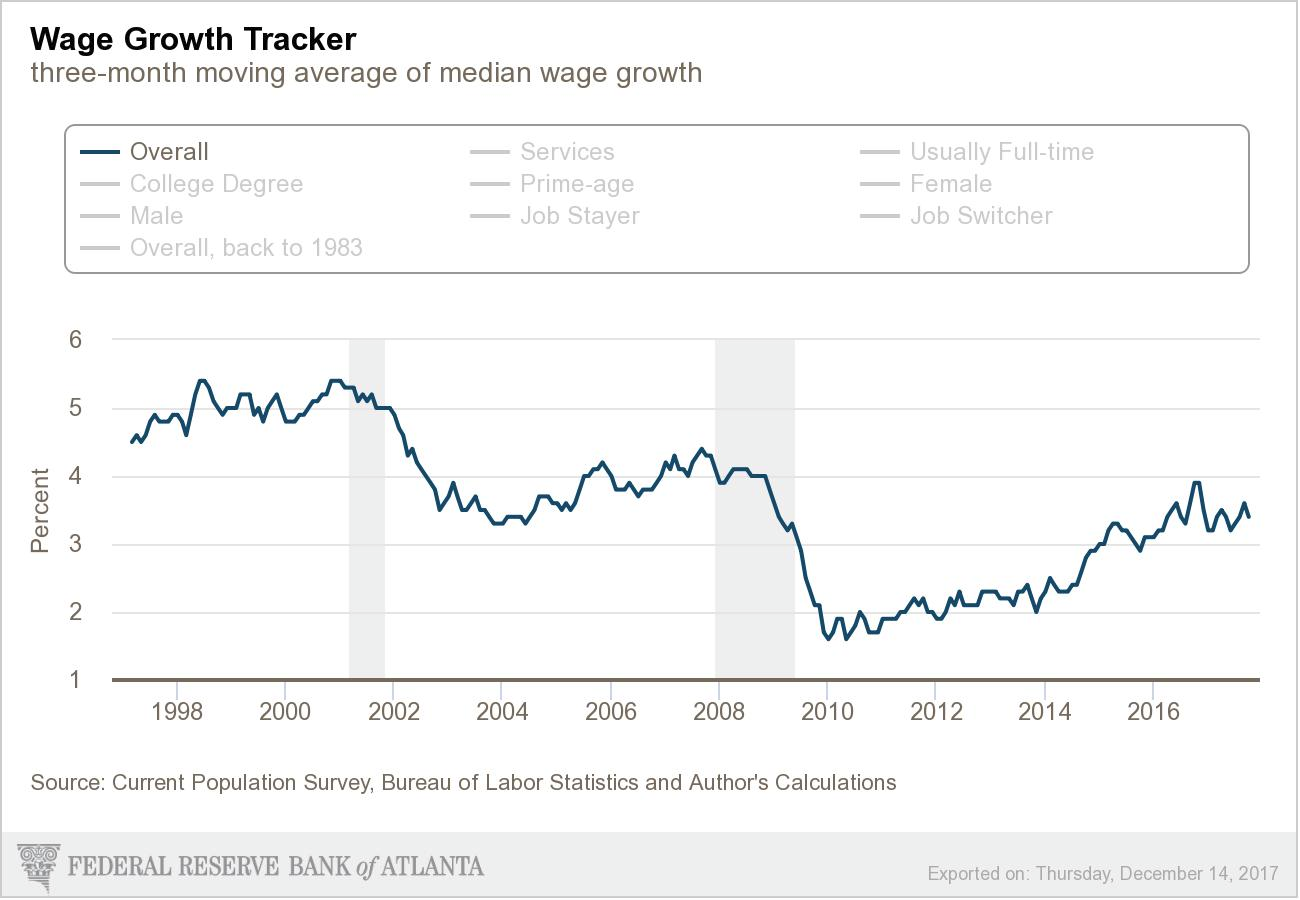
This would all be well and good, but wage growth, though climbing, is still below the last cycle lows.
Our analysts have traveled the world over, dedicated to finding the best and most profitable investments in the global energy markets. All you have to do to join our Energy and Capital investment community is sign up for the daily newsletter below.
3. Slow Wage Growth

This chart compares debt to wage growth.

Furthermore, stocks are overvalued. Most investors would look at price-to-sales and price-to-earnings on the S&P 500, but here is a tool you might have missed…
4. The Warren Buffett Rule

When the ratio of total market cap, or value of all U.S. stocks combined, is around 80% of the gross domestic product (GDP), then stocks are a buy. When it is above 100%, not so much. Right now the ratio is 141.7% — just below the 2000 dot-com bubble peak.
5. Money Printing
Of course, the market is up because of global money printing:

Right now, the U.S. Federal Reserve as well as the Chinese have started to hike interest rates to slow growth and “normalize” monetary policy. In effect, anti-money printing. They will be joined by the ECB and BOE soon enough. Bloomberg predicts that net asset purchases by the central banks will fall from $131 billion in September to $33 billion next year.
It’s always a bad idea to fight the Fed.
Next week, I’ll give you my prediction for 2018.
All the best,

Christian DeHaemer
Christian is the founder of Bull and Bust Report and an editor at Energy and Capital. For more on Christian, see his editor’s page.

